
Ever opened your analytics tab, stared at a wall of charts, and thought, “Am I stupid… or is this just nonsense?” You’re not alone. Most creators were never taught how to read social media analytics, so they either ignore them or obsess over the wrong numbers.
Jump to a section:
- What Is Social Media Analytics?
- Why Reading Social Media Analytics Feels So Hard
- Strategy #1: Start With the Only Metrics That Actually Matter
- Strategy #2: Read a Single Post Like a Marketer (Not a Fan)
- Strategy #3: Use Trends Over Time Instead of Obsessing Over One Post
- Strategy #4: Turn Analytics Into Clear Next Actions
- Why Most People Still Get Bad Results From Social Media Analytics
- Real-World Examples: Turning Confusing Dashboards Into Clear Decisions
- Why Consistency Beats Perfection in Social Media Analytics
- The 7-Step Checklist for Reading Your Social Media Analytics
- FAQ: Common Questions About Social Media Analytics
- Conclusion: Analytics Are Only Powerful When You Act on Them
This guide is the translation layer you’ve been missing. Plain language. No marketing degree. By the end, you’ll know exactly which numbers matter, what they actually mean, and how to turn them into content decisions you can act on.
What Is Social Media Analytics?
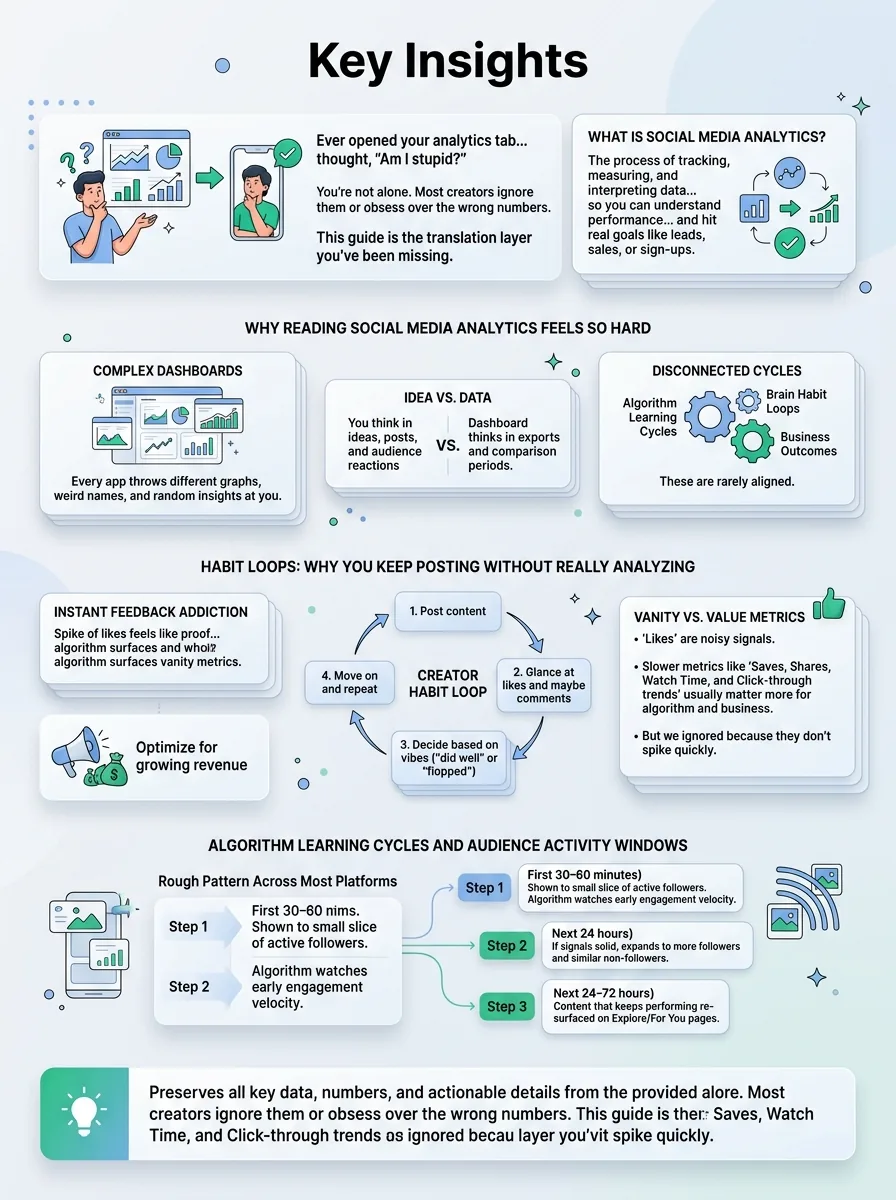
Social media analytics is the process of tracking, measuring, and interpreting data from your social platforms—things like reach, clicks, and watch time—so you can understand how your content is performing, what your audience responds to, and what to change to hit real goals like leads, sales, or sign-ups.
Why Reading Social Media Analytics Feels So Hard
Let’s be honest: the platforms don’t make this easy. Every app throws a different set of graphs, weird names for the same metric, and random “insights” at you. No wonder most creators just post and pray.
The real problem isn’t that you “don’t get numbers.” It’s that the way analytics are shown doesn’t match how you actually work as a creator. You think in ideas, posts, and audience reactions. The dashboard thinks in exports and comparison periods.
On top of that, algorithms run on learning cycles, your brain runs on habit loops, and your business runs on outcomes. Those three are rarely aligned by default.
Habit Loops: Why You Keep Posting Without Really Analyzing
Here’s the loop almost everyone is stuck in:
- Post content
- Glance at likes and maybe comments
- Decide “this did well” or “this flopped” based on vibes
- Move on and repeat
That instant feedback is addictive. Your brain loves quick hits: a spike of likes feels like proof you’re doing something right. The algorithm knows this, so it surfaces those vanity metrics front and center.
The problem? Likes are the noisiest signal. Slow-building metrics—like saves, shares, watch time, and click-through trends—usually matter more for both the algorithm and your business. But because they don’t spike in the first 10 minutes, your brain ignores them.
This is how creators end up optimizing for “looking popular” instead of “growing revenue.”
Algorithm Learning Cycles and Audience Activity Windows
Another reason social media analytics feel so chaotic: algorithms test content in waves, not all at once.
Rough pattern across most platforms:
- First 30–60 minutes: Shown to a small slice of your most active followers. The algorithm watches early engagement velocity (how fast people react).
- Next 24 hours: If signals are solid, it expands to more of your followers and some non-followers with similar behavior.
- Next 24–72 hours: Content that keeps performing can get re-surfaced in feeds, Explore/For You pages, or recommendations.
If you check analytics 15 minutes after posting and declare it dead, you’re judging a race by the first 10 meters. On the flip side, if you post when your audience is asleep, the early engagement window looks terrible, and the algorithm decides your post isn’t worth pushing.
This is why creators swear “Reels are dead” or “LinkedIn is trash” when really… they’re just posting at the wrong times. If you want a deeper example of this in action, the breakdown in How Often to Post on LinkedIn Personal Profile for 3x More Engagement shows exactly how timing and cadence change performance.
Strategy #1: Start With the Only Metrics That Actually Matter
Most analytics problems come from one root issue: you never decided what “success” means for you. So every metric feels equally loud.
The fix is simple: pick your business goal, then map 1–2 primary metrics to it. Everything else is just supporting detail.
Map Your Business Goal to 1–2 Primary Metrics
Forget the 40 metrics your dashboard shows. Start here:
- Goal: Awareness / reach more people
Primary metrics: Reach, Impressions
Example: You’re a new fitness coach trying to get known. If your total monthly reach is going up week over week, you’re winning, even if followers creep up slowly. - Goal: Engagement / build trust
Primary metrics: Engagement rate, Comments, DMs
Example: You sell a higher-ticket service. You’d rather have 20 thoughtful comments and 5 DMs than 5,000 random views. - Goal: Leads / sales
Primary metrics: Link clicks, Conversions (sign-ups, trials, purchases)
Example: If you’re promoting a webinar, the metric that matters isn’t “likes on the promo post,” it’s how many sign-ups came from social.
Pick one goal per platform. Instagram might be awareness and engagement. LinkedIn might be leads. TikTok might just be top-of-funnel reach right now. If you want help planning around that without posting every day, read The Secret to Instagram Growth Without Posting Daily next.
Use Secondary Metrics to Diagnose, Not Distract
Once you know your primary metric, everything else becomes a clue, not the headline.
- Saves: Signal that the content is “valuable” or “reference-worthy.” Great for educational posts.
- Shares: Signal that it’s relatable or status-building. People share content that makes them look smart, funny, or understood.
- Comments: Signal of emotional reaction or curiosity. Questions can mean confusion or interest.
- Profile visits: Signal that your post made them curious about who you are.
- Watch time / retention: Signal of how strong your hook and pacing are in video.
Example: You post a Reel that gets “meh” likes but insane saves and shares. If your goal is awareness, that’s actually a win—the algorithm loves share-heavy posts, and you’ll usually see reach spike later. Secondary metrics explain why the primary metric did what it did.
If numbers overwhelm you, tools that summarize data help a lot. A unified view like the SocialCal Analytics Dashboard pulls your key metrics across platforms into one place so you’re not manually clicking through five different apps trying to compare reach and clicks.
Strategy #2: Read a Single Post Like a Marketer (Not a Fan)
Let’s zoom in. How do you actually “read” analytics for one post without getting lost?
Think of it like this: hook → relevance → conversion. Those are the three stories the data tells you.
Step 1: Look at Reach vs. Followers to Judge the Hook
First check: Reach compared to your follower count.
- If reach is way below your follower count, your hook probably didn’t pass the first test. People saw it but kept scrolling.
- If reach is roughly similar to your follower count, the algorithm showed it to your audience but didn’t push it much further.
- If reach is above your follower count, your hook landed. The algorithm said, “People like this, let’s show more.”
On short-form video, that “hook” is the first 1–3 seconds; on text-heavy platforms, it’s your first line or headline. If you want to experiment with hooks, tools like a Viral Hook Tester are handy for A/B-style testing opening lines before you even post.
Step 2: Check Engagement Rate to Judge Relevance
Next, calculate engagement rate. Simple version for most platforms:
(Likes + Comments + Shares + Saves) ÷ Reach × 100
Rough benchmarks (these vary by niche, but helpful as a sanity check):
- Instagram feed posts: 1–3% is normal, 4–6% is strong, 7%+ is excellent
- Reels / TikTok: 3–6% is normal, 7–10%+ is strong
- LinkedIn posts: 2–4% is solid, 5–7%+ is great
Look, don’t obsess over exact percentages. Use them to compare you vs. you. If your average is 3% and one post hit 7%, ask: what was different about the topic, angle, or format?
If you’re consistently lost on what to post where, the breakdown of formats and engagement in The Complete Guide to Posting on Threads and Bluesky in 2025 (And Why You Should Start Now) is a nice reference for how different platforms reward different styles.
Step 3: Follow the Clicks to Judge Conversion Intent
Finally, look at behavior that moves people closer to your business goals:
- Link clicks: How many people cared enough to leave the platform?
- Profile visits: Did they go check you out?
- Website actions: Did they sign up, book, or buy?
Here’s the nuance: not all clicks are equal.
- High clicks but low time-on-site or high bounce rate (from Google Analytics) often means curiosity—the promise in your post didn’t match the landing page.
- Fewer clicks but a high percentage converting means your post is attracting the right people with the right expectations.
For sales-focused creators, your “best” post is usually the one with the highest conversion rate, not the one with the most views.
Strategy #3: Use Trends Over Time Instead of Obsessing Over One Post
Imagine you just spent an hour on a carousel. It flops. Next day, you throw together a meme in 3 minutes and it pops off. If you’re only looking post-by-post, your analytics will emotionally whiplash you into bad decisions.
The fix: zoom out. Weekly and monthly trends matter way more than any single post.
Build Simple Weekly and Monthly Trend Views
Once a week, set a 10–20 minute block to review:
- Total reach
- Followers gained (or lost)
- Total website clicks from social
- Number of posts published by format (Reels, carousels, etc.)
Once a month, compare those same metrics month-over-month. Are they trending up, flat, or down?
This is how you stop saying “Nothing is working” when, actually, your reach is up 40% and clicks are up 20%, but you got hung up on three posts that underperformed. If you hate spreadsheets, a content calendar with built-in stats like the SocialCal Content Calendar makes this easier because you see posts and performance on the same screen.
Compare Content Types and Topics Side by Side
You can’t improve what you don’t categorize. At a minimum, tag each post with:
- Format: video, carousel, single image, Story, live
- Topic: how-to, story, behind-the-scenes, opinion, promo
Then review: Over the last month, which formats consistently drove your primary metrics? Which topics did the same?
Example: You might notice how-to carousels bring followers, but personal story Reels drive DMs and leads. That tells you exactly what to make more of depending on your current focus.
If you’re mainly on TikTok, steal from systems built for audits. The breakdown in The 4-Part TikTok Content Audit Checklist System is a perfect example of turning chaotic content into clear categories you can evaluate.
Strategy #4: Turn Analytics Into Clear Next Actions
Analytics are only useful if they change what you do next. Most creators stop at “Huh, that’s interesting” and never touch their strategy.
You need a simple rule-set: keep, tweak, or kill.
The Keep / Tweak / Kill Framework
Every week, look at your last 5–10 posts and decide for each:
- Keep: Posts that hit or exceeded your primary metric.
Action: Make a sibling version. Same topic, new angle or format. - Tweak: Posts with good signals in secondary metrics but missed the primary metric.
Action: Adjust hook, thumbnail, or CTA and test again. - Kill: Posts that underperformed across the board and don’t match your long-term positioning.
Action: Stop making that type for now.
Set rough thresholds. For example: “Keep anything with 2x my average reach or above-average click-through. Tweak if engagement is 20% above normal but clicks are weak. Kill if it’s below 50% of my average reach and low engagement.”
Turn Insights Into a Simple Test Plan
Analytics should always lead to tests. Pick 2–3 experiments per month, not 20.
Examples:
- Same topic, two different hooks on Reels
- Same carousel, two different CTAs
- Same format, two different posting times
Run each test a few times before deciding. One post is noise. Three similar posts start to be a pattern.
And don’t change everything at once. If you change topic, format, posting time, and CTA in the same week, your social media analytics can’t tell you which change worked. If you want a bigger picture of how to structure posting and testing so it fits your week, How to Save 15+ Hours Every Week on Social Media (The Creator's Scheduling Playbook) is a solid companion.
Why Most People Still Get Bad Results From Social Media Analytics
Even with all this, creators still sabotage themselves. Here are the big traps.
Mistake #1: Chasing Vanity Metrics Instead of Business Outcomes
If your main questions are “How do I get more likes?” and “How do I go viral?”, your content will drift toward cheap engagement. Relatable memes, outrage, low-intent fluff.
The fix: every time you look at analytics, ask, “How did this move people toward my actual goal—email list, demo, sale, booking, whatever?” If the answer is “it didn’t,” it’s not a win, no matter how many fire emojis you got.
Mistake #2: Judging Posts Too Soon (Before the Algorithm Finishes Testing)
Most creators call a post dead within an hour. Especially on Reels and TikTok, that’s just wrong. Content can warm up days later when it hits the right audience pocket.
Rule of thumb:
- Twitter/X: Give it 24 hours
- Instagram, TikTok, LinkedIn: 24–72 hours
- YouTube: 3–7 days, especially for long-form
Do an initial check same day for red flags. Save final judgment for the end of that window.
Mistake #3: Changing Too Many Variables at Once
Creators love “new strategy” energy. New style, new times, new topics—all at once. Then the analytics turn into soup. You have no idea what caused what.
Fix: only change 1–2 variables per test cycle. For example: keep topics and CTAs consistent for two weeks, only test times and hooks. Then swap.
Mistake #4: Ignoring Audience Activity and Time Zones
If most of your audience is in the US and you’re posting at 2am EST, your post starts its life in a graveyard. Low early engagement = the algorithm assumes it’s boring.
Before changing your whole content strategy, check your audience activity times in native insights or a scheduling tool. Then post as close as possible to when the largest chunk of your audience is already active.
Mistake #5: Only Looking at Native Analytics, Never the Full Funnel
Posts can “flop” in-platform but crush where it matters: your site or your product.
Example: A LinkedIn post with average reach but super high clicks that lead to demo requests is more valuable than a viral hot take that sends nobody to your site. Connect your social media analytics to website analytics, email data, and CRM where you can. That’s the real scorecard.
Real-World Examples: Turning Confusing Dashboards Into Clear Decisions
Example #1: From “Reels Are Dead” to 3x Reach in 30 Days
A small skincare brand DMed me convinced Reels were over. Their last 10 Reels barely reached 1,000 people with 8k followers.
We pulled their analytics and saw two clear things:
- Reach was low and their first 3 seconds were always the same: slow logo intro.
- But the few Reels that opened with a face + bold line (“Stop doing this to your skin…”) had 2–3x watch time and saves.
We didn’t change niche. We didn’t change posting frequency. We only changed the hook and first 3 seconds, and shifted posting to the time when their followers were most active.
Result in 30 days: average Reel reach 3x’d, saves tripled, and they started seeing regular product page visits from Reels. Reels weren’t dead—their intros were.
Example #2: Cutting Posting Frequency but Doubling Website Clicks
A small SaaS company was posting 2–3 times per day on LinkedIn and Instagram. Their CMO was burnt out, and social traffic to the site was flat.
We looked at 90 days of data, tagged posts by type, and noticed something hilarious: almost all their trial sign-ups came from a tiny set of deep-dive educational posts, not from the daily “brand awareness” fluff.
So we cut posting to 4–5 high-intent posts per week, each with a clear CTA. Engagement per post went up, website clicks doubled, and trials from social increased—even though they were posting less.
If you’re in that “posting constantly but nothing’s moving” stage, this is where a monthly performance review and planning session (ideally inside a visual calendar) pays off. Comparing tools like Buffer vs. Hootsuite vs. Later vs. SocialCal can help you pick something that fits your stack when you’re ready.
Why Consistency Beats Perfection in Social Media Analytics
Most creators obsess over the perfect hook, perfect format, perfect posting time. But the algorithm—and your analytics—care more about something way less sexy: patterns.
Algorithms Learn From Patterns, Not One-Off Posts
Algorithms are basically pattern-recognition machines. They ask: Who interacts with your content? When? What topics? What formats?
If you post three times one week, then disappear for 10 days, then spam-post six times in a day, there’s no clean data pattern. The algorithm can’t reliably test your content, and you can’t tell if last Tuesday’s spike was the topic, timing, or just randomness.
Regular posting—doesn’t need to be daily—creates a stable environment. That stability makes your social media analytics way easier to interpret because there’s less chaos in the inputs.
Scheduling Turns “I’ll Do It Later” Into Actual Data
The real enemy of good analytics isn’t ignorance. It’s inconsistency. “I’ll post later” is how experiments never run and insights never stack.
Scheduling tools remove willpower from the equation. You batch-create, set your posts to go out at your best times, then read the results calmly instead of panic-posting whenever you remember.
For example, if Instagram is your main platform, using an Instagram Scheduler lets you plan Reels, carousels, and even first comments in advance so you can focus your brainpower on reading what happened, not just getting something out. Clean, consistent posting = cleaner data = better decisions.
If you’re nervous that scheduling hurts reach, the breakdown in Does scheduling Instagram posts reduce reach? 3-step check walks through how to test that for your own account instead of guessing.
The 7-Step Checklist for Reading Your Social Media Analytics
Step-by-Step Weekly Analytics Routine
- Set your time window.
Choose the last 7 days. Ignore anything posted less than 24 hours ago (or 72 hours for Reels/TikTok). - Check goal metrics first.
Look at your primary metrics per platform (reach, engagement rate, clicks, conversions). Ask: up, flat, or down vs. last week? - Review your top 3 posts.
Sort by your primary metric. For each, note: topic, format, hook, CTA, and posting time. - Review your bottom 3 posts.
Same thing. Topic, format, hook, CTA, time. Look for patterns in what consistently underperforms. - Note content types and topics.
Group posts by format and topic. Which combos did best for your goal? (e.g., how-to Reels for reach, story carousels for DMs.) - Review timing.
Check when your best and worst posts were published. Do “good” posts cluster around specific days or hours? - Plan 2–3 tests and schedule them.
Decide your small experiments for next week (hooks, times, CTAs) and schedule them so they actually happen.
If you’re posting across multiple platforms, a unified planner like SocialCal’s Multi-Platform Publishing keeps you from guessing which test is running where—you see it all on one calendar.
FAQ: Common Questions About Social Media Analytics
How often should I check my social media analytics?
Quick daily glance is fine, but don’t judge performance off it. Aim for one weekly review (15–30 minutes) and one deeper monthly review to spot trends. Checking analytics 10 times a day usually just leads to emotional decisions instead of clear strategy tweaks.
What are the most important social media analytics for small businesses?
If you’re a small team, keep it simple:
- Reach – Are more people seeing you?
- Engagement rate – Do they care?
- Website clicks – Are they willing to leave the app?
- Conversions – Do they sign up, book, or buy?
Local service? Focus on DMs and inquiries. E-commerce? Track product page visits and purchases from social. SaaS? Watch trials, demos, and email sign-ups.
How long should I wait before evaluating a post’s performance?
As a rule:
- Twitter/X: 24 hours
- Instagram, TikTok, LinkedIn: 24–72 hours
- YouTube: 3–7 days
You can do a quick check earlier for obvious hits or flops, but make final calls after that window. Some content ramps slowly and then takes off once it finds the right audience pocket.
How do I know if my social media is actually working?
Connect the dots. Ask:
- Are people coming from social to my site?
- Once they land, are they signing up, booking, or buying?
- When I post more of X (topic/format), do those outcomes increase?
When your social media analytics line up with real-world outcomes—more leads, sales, or clients—you’re on track, even if you’re not “viral.”
Do I need paid tools, or are native social media analytics enough?
If you’re just starting on one platform, native analytics are fine. Once you’re on multiple platforms, posting regularly, or managing clients, a central scheduling + analytics tool saves a ton of time and confusion.
At that point, it’s less about “fancy features” and more about: Can I see my key metrics together? Can I schedule tests easily? Tools like SocialCal, Buffer, Hootsuite, and Later all do this differently—this comparison breaks down which fits solo creators best.
Conclusion: Analytics Are Only Powerful When You Act on Them
You don’t need a marketing degree to read social media analytics. You just need clear goals, a small set of metrics, and a simple routine for turning numbers into tests.
Growth isn’t about perfect posts. It’s about consistent posting, consistent review, and consistent small adjustments. If you can batch your ideas, schedule them through something like a visual calendar in SocialCal, and then spend your energy reading what happened, your analytics will finally start feeling like a map instead of a migraine.


