
Why You’re Feeling 'Data Drowning': The Struggle to Define Success
You open Instagram. You check your latest Reel. The native analytics dashboard shows a wall of green arrows and a spike in profile visits. Your brain releases a nice little hit of dopamine.
Jump to a section:
- Why You’re Feeling 'Data Drowning': The Struggle to Define Success
- What Are Social Media Analytics Metrics?
- The Signal-to-Noise Problem: Why Measuring Social Impact Is Behaviorally Hard
- Strategy 1: Awareness Metrics—Measuring Your Brand’s Digital Footprint
- Strategy 2: Engagement Metrics—Quantifying Community Resonance
- Strategy 3: Conversion Metrics—Connecting Social to the Bottom Line
- Strategy 4: Customer Care Metrics—The 'Quiet' Growth Levers
- Strategy 5: Share of Voice (SOV)—Contextualizing Your Competitive Position
- 5 Common Mistakes That Sabotage Your Social Media Reporting
- Real-World Scenarios: Translating Analytics into Growth
- The Consistency Bridge: Why Data is Useless Without a Cadence
- Your Social Media Analytics Implementation Checklist
- Frequently Asked Questions About Social Metrics
- Conclusion: Turning Insights into Impact
Then you check your Stripe dashboard.
Flatline.
Ready to save 15+ hours every week?
Join other creators who've automated their social media with SocialCal.
Get started freeThis is the exact moment most creators realize they are drowning in data but starving for actual insight. Platforms give us access to hundreds of different numbers, charts, and percentages. They want you obsessed with these dashboards because checking them builds a habit loop that keeps you opening their app.
If you are searching for social media analytics metrics explained in a way that actually translates to business growth, you have to stop looking at the numbers the platforms want you to care about. Instead, you need a filter. You need to know which three or four metrics actually dictate whether your content is moving the needle, and which ones are just algorithmic noise designed to make you feel productive.
What Are Social Media Analytics Metrics?
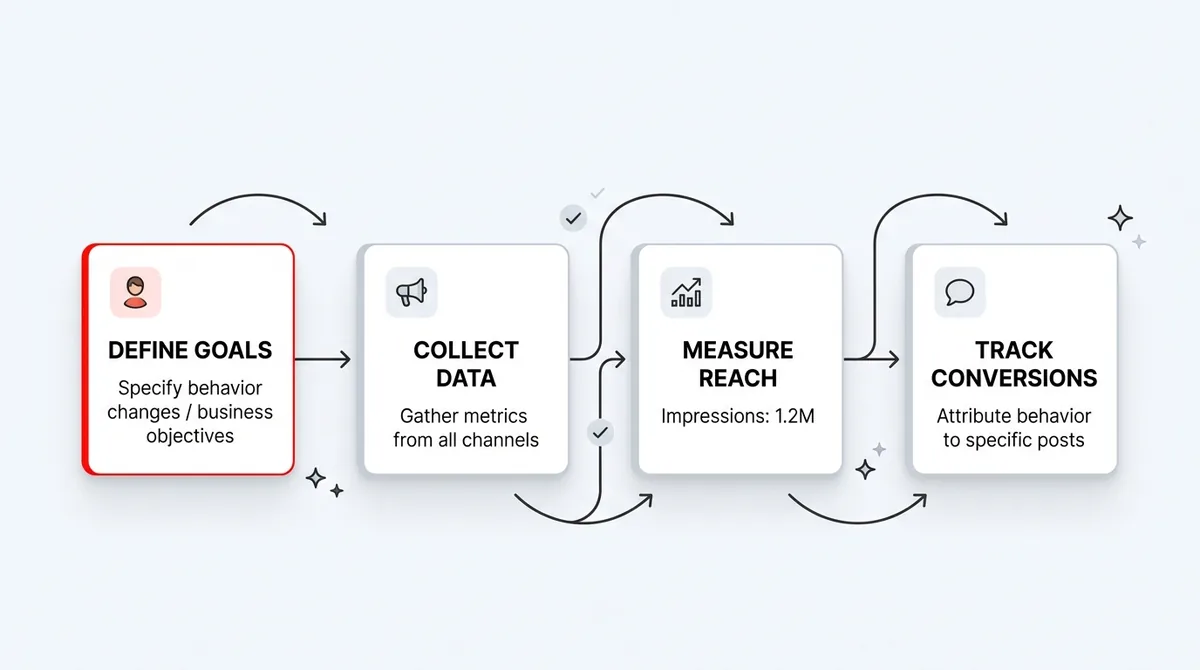
To get social media analytics metrics explained simply: they are the specific data points used to track the performance and ROI of your content across social platforms. These metrics are typically grouped into four main categories: awareness, engagement, conversion, and customer care.
The Signal-to-Noise Problem: Why Measuring Social Impact Is Behaviorally Hard
Here is what nobody tells you about social media reporting.
The algorithms are not transparent machines. They are highly complex behavioral engines that shift constantly. When you try to measure your impact, you are not just measuring your content's quality. You are measuring your audience's habit loops, the platform's current machine learning cycle, and competitive activity windows all at once.
Let's say a post flops. Was the hook bad? Or did you just happen to post during a major cultural event that sucked all the algorithmic oxygen out of the room?
Because humans are wired to seek immediate feedback, creators naturally gravitate toward vanity metrics. Likes and views are easy to see. They update in real-time. But optimizing for likes usually means creating lowest-common-denominator content. You end up chasing viral trends that attract thousands of eyeballs but exactly zero qualified leads.
To actually grow, you have to separate the signal from the noise.
Strategy 1: Awareness Metrics—Measuring Your Brand’s Digital Footprint
Awareness metrics sit at the very top of your funnel. They answer a single, brutal question: Does anyone even know you exist?
Mechanistically, platform algorithms test your content in batches. When you hit publish, the algorithm shows your post to a small "seed" audience of your most active followers. If that group stops scrolling and actually looks at the post, the algorithm flags it as engaging and pushes it to a wider audience, including non-followers.
This early momentum is why getting your social media analytics metrics explained properly requires understanding the difference between volume and unique eyeballs.
Reach vs. Impressions: Understanding the Viral Coefficient
Most creators use these terms interchangeably. That is a massive mistake.
Reach is the number of unique individual accounts that saw your content.
Impressions is the total number of times your content was displayed on a screen, regardless of whether it was the same person looking at it multiple times.
Imagine you run a B2B SaaS company and you just launched a new feature. You post a breakdown on LinkedIn. The post gets 50,000 impressions but only 10,000 reach.
What does that tell you?
It tells you that the average person who saw your post looked at it five times. Your virality rate—the spread to new people—was actually quite low, but your resonance with your core audience was insanely high. They were likely reading it, leaving the app, and coming back to reference it later. If you only looked at the 50k impressions, you might mistakenly think you reached a massive new audience.
Action step: Next time you review your top-performing post, divide your impressions by your reach to calculate your frequency rate. If the number is above 2.5, that piece of content is highly "saveable" and you should make more like it.
Strategy 2: Engagement Metrics—Quantifying Community Resonance
Awareness gets people to stop scrolling. Engagement gets them to care.
Middle-of-funnel metrics measure the stickiness of your content. Algorithms are increasingly prioritizing deep engagement over shallow engagement. A passive "like" is worth almost nothing to the TikTok or Instagram algorithm today. What they want is watch time, saves, and shares.
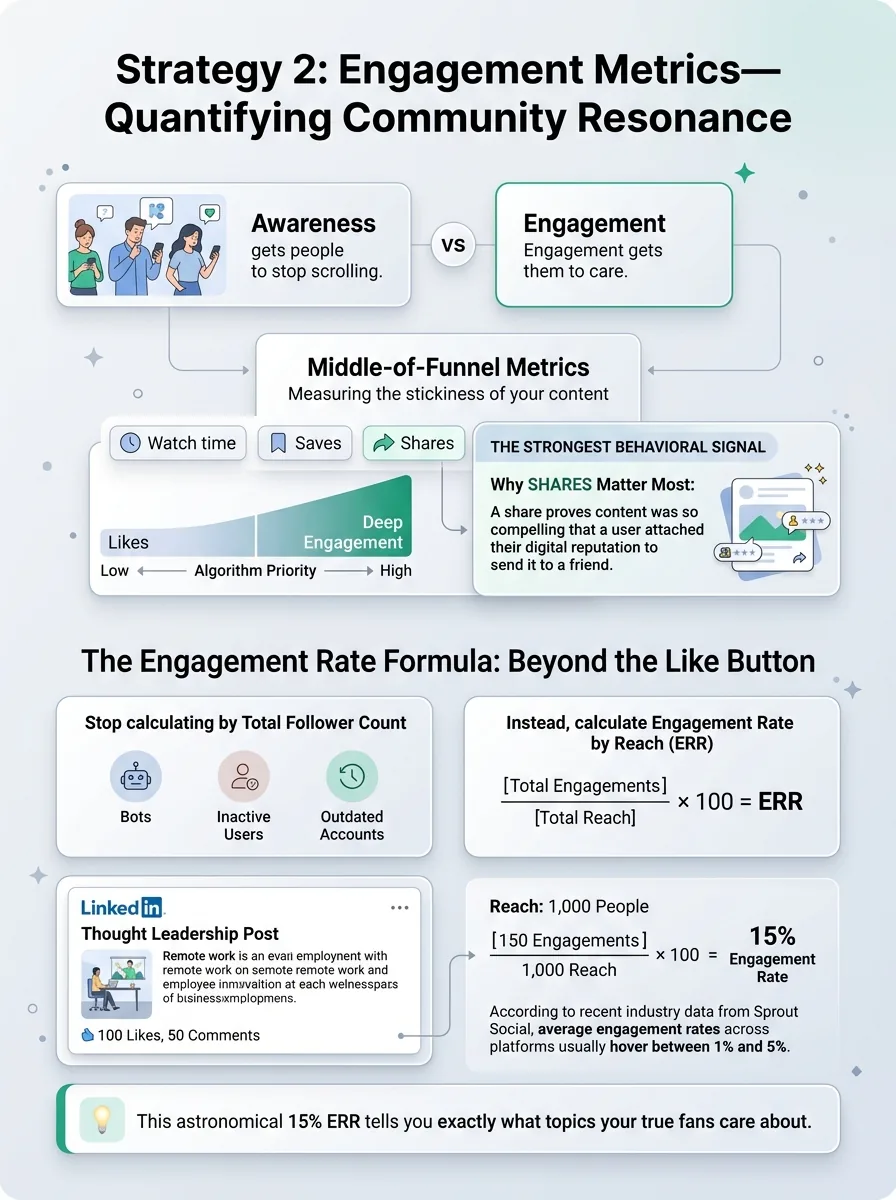
Why? Because a share proves that your content was so compelling that a user was willing to attach their own digital reputation to it by sending it to a friend. That is the strongest behavioral signal a platform can receive.
The Engagement Rate Formula: Beyond the Like Button
If you want a solid baseline, our beginners guide to social analytics breaks down the basic math, but let's look at how to apply it in practice.
Stop calculating engagement rate by dividing interactions by your total follower count. Your follower count includes bots, inactive users, and people who haven't logged in since 2019.
Instead, calculate Engagement Rate by Reach (ERR). Divide your total engagements by your total reach, then multiply by 100. This tells you the percentage of people who actually chose to interact after seeing your content.
Consider a LinkedIn thought leadership post. You write a controversial take on remote work. It gets 100 likes and 50 comments. A junior marketer might look at the 100 likes and shrug. But if you dig into the data and see the reach was only 1,000 people, you have a 15% engagement rate. That is astronomical. According to recent industry data from Sprout Social, average engagement rates across platforms usually hover between 1% and 5%.
That 15% tells you exactly what topics your true fans care about.
Strategy 3: Conversion Metrics—Connecting Social to the Bottom Line
This is where creators turn into businesses.
Bottom-of-funnel metrics track how effectively you are moving attention off rented land (the social platform) and onto your owned properties (your website, your email list, your checkout page).
Social platforms actively hate this. Their entire business model relies on keeping users inside their app to serve them ads. When you post a link, the algorithm naturally suppresses your reach. To overcome this penalty, your content has to be incredibly persuasive.
Click-Through Rate (CTR) and the Direct Intent Loop
Click-Through Rate is the ultimate measure of creative efficacy. It measures the percentage of people who saw your call-to-action and actually took the next step.
Algorithms monitor what we call the Direct Intent Loop. If a user clicks your link in bio, goes to your site, and immediately hits the back button to return to Instagram within two seconds, the platform registers a "bounce." Do this enough, and the platform will throttle your account's visibility.
But if they click the link and stay gone for three minutes, the platform assumes your link was highly relevant and valuable.
Say you run an Instagram Ad campaign for a digital course. You are getting a massive amount of link clicks, but no sales. Your CTR is high, but your conversion rate is zero. The problem isn't your social media content. Your content did its job perfectly. The problem is your landing page.
Action step: Never post a link without a UTM parameter. These simple text tags attach to your URLs and tell your Google Analytics exactly which specific tweet or story drove the sale. If you need to present this data to clients, a clean social media ROI report can automatically translate those UTM clicks into actual dollar values.
Strategy 4: Customer Care Metrics—The 'Quiet' Growth Levers
We rarely talk about customer support as a growth engine, but on social media, retention is just as important as acquisition.
Algorithms monitor how accounts interact with their audiences. An account that broadcasts content but never replies to comments is treated differently than an account that actively fosters community dialogue.
Response Time and Sentiment Analysis: Measuring Brand Health
The speed at which you handle a complaint or answer a question in your DMs matters. Meta actually rewards Facebook Pages with a "Very responsive to messages" badge if they reply quickly, which acts as a trust signal to new profile visitors.
Beyond speed, you need to track sentiment. Are the comments on your YouTube videos generally positive, negative, or neutral? If your engagement rate suddenly spikes, but the sentiment is 80% negative because you made a controversial mistake, that spike is a crisis, not a victory.
Action step: Dedicate 15 minutes immediately after posting to reply to every single comment. This not only boosts early engagement velocity but trains the algorithm that your account is an active participant, not just a billboard.
Strategy 5: Share of Voice (SOV)—Contextualizing Your Competitive Position
Looking at your own analytics in a vacuum is dangerous.
Let's say your organic traffic from X (formerly Twitter) grew by 15% this quarter. You might celebrate. But what if the overall conversation around your industry grew by 60% during that same period? You didn't win. You actually lost market share.
Share of Voice measures your brand's visibility compared to your competitors. It involves tracking how often you are mentioned or tagged versus how often the top three players in your space are mentioned.
This provides necessary context. If your engagement dips in July, but you check your SOV metrics and see that every competitor also saw a massive dip, you know it's a seasonal industry trend, not a flaw in your content strategy.
5 Common Mistakes That Sabotage Your Social Media Reporting
Even teams with massive budgets mess this up. They track everything and learn nothing.
Mistake #1: Prioritizing Vanity Metrics Over Business Value
I see this all the time. A creator will brag about a TikTok hitting 2 million views, but their email list grew by four people. Stop optimizing for the algorithm at the expense of your ideal customer. A highly technical post that reaches 500 decision-makers is infinitely more valuable than a generic meme that reaches 50,000 teenagers.
Mistake #2: Ignoring Platform-Specific Attribution Windows
You cannot measure TikTok the same way you measure LinkedIn.
TikTok is an entertainment platform. People rarely stop watching a video to click a link in a bio and buy something immediately. They might watch your videos for three weeks, then manually Google your brand name later. If you use a strict 1-day click attribution window, TikTok will look like a terrible channel. Check out Meta's own documentation on attribution windows to understand how drastically a 7-day click vs 1-day view setting changes your data.
Mistake #3: Chasing the Wrong Competitors
Benchmarking yourself against Apple or Nike is pointless. Compare your metrics to accounts that are roughly your size, in your specific niche.
Mistake #4: Reporting Without Context
Never hand a client or a boss a spreadsheet of numbers without a narrative. "We got 10k more impressions this month" means nothing. "We got 10k more impressions this month because we shifted from single images to carousel posts, which increased our average dwell time" is an actionable insight.
Mistake #5: Changing Variables Too Quickly
If you change your posting time, your format, your hook style, and your call-to-action all in the same week, you will have no idea which change actually caused your metrics to go up or down. Test one variable at a time.
Real-World Scenarios: Translating Analytics into Growth
Let's look at how actual creators use this data to pivot.
I know a B2B marketing agency that used to post broad "marketing tips" on Instagram. Their reach was incredible. They were getting thousands of likes per post. But their leads were terrible—mostly college students asking for homework help.
They looked at their analytics and realized their conversion rate to actual sales calls was near zero.
They made a hard pivot. They started posting highly specific, dense case studies about SaaS customer acquisition costs. Their reach dropped by 80%. Their likes plummeted. But their conversion rate skyrocketed, and they booked three enterprise clients in a month.
They stopped caring about awareness metrics and started optimizing entirely for conversion.
The Consistency Bridge: Why Data is Useless Without a Cadence
Here is the hard truth about social media analytics metrics explained in practical terms.
Data requires statistical significance. If you post three times one week, vanish for a month, and then post a flurry of updates on a random Tuesday, your analytics are completely useless. The algorithm won't know who your audience is, and you won't have enough data points to establish a baseline.
The real issue isn't finding the perfect metric to track. It's being able to produce content consistently enough to feed the data loop.
You need a steady rhythm so that when a spike or a dip happens, you know it's because of the content, not because of an erratic posting schedule. This is exactly why professionals rely on a visual content calendar. By batching your work and scheduling it weeks in advance, you remove human error from the equation. The content goes out like clockwork, the algorithm learns exactly when to expect your posts, and the data you collect is actually clean enough to make decisions with.
Your Social Media Analytics Implementation Checklist
Ready to stop guessing? Follow these steps.
Phase 1: Setting Your Baseline Benchmarks
Audit your last 30 days: Pull your total reach, average engagement rate, and total link clicks for the past month. Write these down. This is your baseline.
Define your ONE metric that matters: Choose one primary KPI based on your current business goal. If you are a new brand, choose Reach. If you are an established brand launching a product, choose CTR.
Standardize your UTMs: Create a simple spreadsheet to track your UTM parameters so your Google Analytics stays clean.
Schedule your review day: Pick one day a month (like the 1st or the 15th) specifically for data review. Don't look at your macro analytics outside of this day.
Run controlled tests: Pick one variable to test next month. E.g., "For the next 30 days, we will use text-only hooks instead of video hooks on LinkedIn."
Ready to save 15+ hours every week?
Join other creators who've automated their social media with SocialCal.
Get started freeFrequently Asked Questions About Social Metrics
What is the most important social media metric?
There is no single "best" metric. The most important metric depends entirely on your current business objective. If you want brand awareness, track Reach. If you want community loyalty, track Engagement Rate. If you want revenue, track Click-Through Rate and Conversions.
How do I track ROI on social media?
To track Return on Investment, you must attach a financial value to your conversions. Use UTM parameters on all your social links to track users to your website. Set up conversion goals in Google Analytics to see exactly how much revenue was generated from specific social campaigns, then divide that revenue by the cost of creating the content.
What are the 4 categories of social media metrics?
The four main categories are Awareness (reach, impressions, follower growth), Engagement (likes, comments, shares, saves), Conversion (click-through rate, cost per click, sales), and Customer Care (response time, sentiment, resolution rate).
Why is my reach higher than my impressions?
It shouldn't be! Reach is unique viewers, while impressions are total views. Impressions will always be equal to or higher than reach. If 100 people see your post once, your reach is 100 and impressions are 100. If those same 100 people look at it twice, your reach is still 100, but your impressions are 200.
Conclusion: Turning Insights into Impact
Having your social media analytics metrics explained doesn't mean much if you just leave the numbers sitting in a spreadsheet. Data is only valuable if it changes your behavior. Growth isn't about perfectly predicting the algorithm; it's about consistently testing, measuring the reality of the results, and adjusting your course.
Build your baseline, stop obsessing over the daily vanity spikes, and commit to the process. Once you have that steady cadence running, the numbers will finally start working for you instead of against you.


